Real-Time Analytics: Measure, See and Report the Success of Your Trade Shows and Meetings

Analytics to the rescue!
Now there’s no more guessing how well your trade show or meeting performed. With our real-time analytics and downloadable data exports, you’ll know how well your interactive trade show game and audience response app did, during and after the event.
With our analytics you’ll be able to:
- Track your progress in real time with our dashboard reports
- Identify opportunities for improvement and celebrate your success
- Download the data into excel for further analysis or loading into your CRM
Here’s a guide to our built-in, real-time analytics and reports you’ll get with SocialPoint:
Analytics included with SocialPoint’s Interactive Trade Show Games
Challenge Bar Trivia Analytics Dashboard

What it tracks:
Our Challenge Bar Trivia game includes a wealth of stats and charts that report in real time key metrics about attendee participation in your game:
- How many people played your game at least once, total number of games played, and the total number of questions answered by all game players. (In the example chart you can see 500 people played a total of 786 games and answered 8,152 questions – that’s engagement!)
- Counts players who played the game once, twice, three time, and so on.
- Compare game activity levels across days of the show (In the example chart you can see the game playing counts dip at lunch time, and that day 2 had bigger activity spikes than day 1.)
- Counts of game players by day, and percent of correctly and incorrectly answered questions.
How it helps you:
- You can share the analytics charts and detailed data with your boss, who will love having proof of the number of booth visitors, lead counts, and level of engagement with questions answered
- You can better forecast booth staffing needs based on game activity charted hour by hour.
- You can evaluate the performance of your entire show schedule by comparing game activity levels across different years, or different shows in the same year.
- For those who want to dig deeper, you can view another included report on number of correct questions by group of trivia questions. If you set up question groups by product or booth station or sponsor, you can then report the number and percent of questions answered correctly by question group to your different stakeholders.
- You can also export individual player’s answering success by group, and then target your follow up to attendees based on topics they performed worst on – and thus need more training.
Virtual Prize Wheel Analytics Dashboard

What it tracks:
Our Virtual Prize Wheel game reports in real time key metrics about attendee participation in your game:
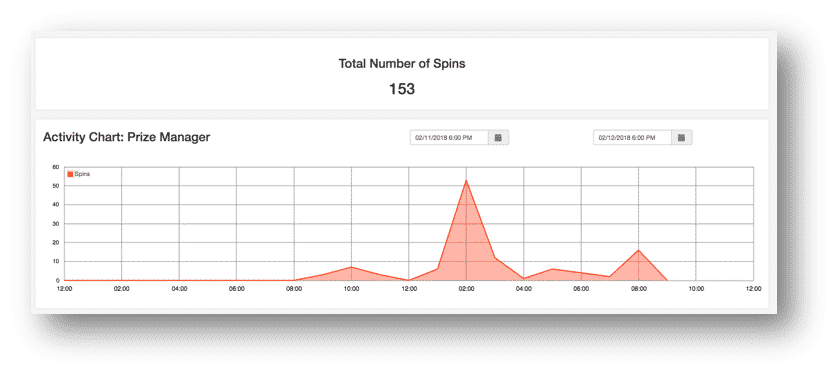
- Depending on how you set up the Virtual Prize Wheel, see charts and get counts on how many times the wheel was spun (in the first example, without lead capture, 153 spins; in the second example, with lead capture, 977 spins and leads captured).
- Compare game activity levels across the day or days in the show (In the first example chart you can see several times of higher activity, with the biggest spike at 2 pm; in the second there is a plateau of activity from 10 am to 1pm).
How it helps you:
- You can share the analytics charts and detailed data with your boss, who will love having proof of the number of booth visitors, lead counts, and prizes won.
- You can better forecast booth staffing needs based on game activity charted hour by hour (in the second example the extended plateau of lead activity from 10 am to 1 pm was likely because the game was at capacity and could have generated more leads with more iPads loaded with games).
- You can evaluate the performance of your entire show schedule by comparing game activity levels across different years, or different shows in the same year — especially if you purchase annual pricing.
- When the Virtual Prize Wheel is set up to capture lead data, you can also download what each person won (not shown here) and customize your follow up by mentioning their prize in your post-show fulfillment letter.
Digital Fishbowl Analytics Dashboard

Our Digital Fishbowl game reports in real time key metrics about attendee participation in your game:
- See charts and get counts on how many times a lead self-entered their contact data and completed a survey (in this example 91 leads and 90 surveys).
- Compare lead activity levels across the day or days in the show (in the example chart you can see three peak times at a three-day trade show, with the first day highest).
How it helps you:
- You can share the analytics charts and detailed data with your boss, who will love having proof of the number of booth visitors and lead counts.
- You can better forecast booth staffing needs based on game activity charted hour by hour. You can see during the spikes how having the Digital Fishbowl helps an exhibitor capture leads that would have been lost when all booth staffers were occupied.
- You can evaluate the performance of your entire show schedule by comparing game activity levels across different years, or different shows in the same year.
Analytics included with SocialPoint’s Interactive Meeting Solutions
Social Media Wall & Hub Analytics Dashboard

What it tracks:
Our Social Media Wall comes with built-in analytics, including a continuously updated chart that shows you all kinds of metrics about your event’s activity on Social Media. It includes:
- How many tweets and photos and videos were created using the event’s hashtag.
- Histogram that graphically charts the social media activity by date and time across your event, so you can see high and low activity points.
- Counts of shares via Twitter, Instagram, and if you host a private event and want to track it, even across SMS and MMS.
How it helps you:
- You can share the analytics charts and detailed data with your boss or event sponsors, who will love having proof of the level of engagement and interactions.
- You can make changes to your meeting design based on what you learn from the social media analytics, creating more “Instagrammable” moments or podium calls to action to encourage people to move from 1 or 2 participant activities each to 4 or 5 each.
Audience Response System App Analytics Dashboard

What it tracks:
Our Audience Response App helps you keep track of the overall engagement and the topics of most interaction. It includes:
- How many times meeting attendees asked a question, responded to a discussion or poll, or took a survey.
- Counts of audience response across all the same metrics, but broken out by each session or activity you hosted
How it helps you:
- You can share the report with your boss or event sponsors, who will love having proof of the level of engagement and interactions.
- You can view the detailed answers and feedback from your event attendees (not shown here) to guide your organization’s decision making
- You can also export individual attendee’s responses by session and provide that feedback to the speakers and presenters.
When you are initially considering an interactive trade show game or meeting app with SocialPoint you are understandably more focused on improving your attendee counts and engagement.
Yet, once the event is over, you’ll be very happy to have these visually clear analytic reports and deep dive data exports to share your success and provide insights into how to be even more successful at your next event.
If you’d like to see more about how you can drive more booth traffic and capture leads with our interactive trade show games, and boost audience engagement with our interactive meeting apps, feel free to contact us with questions or to discuss your event with one of SocialPoint’s Digital Strategists. We’ll help you generate excitement, crowds, and engagement